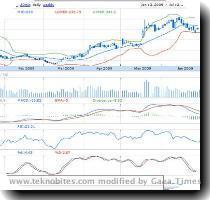
google finance technicals
Divergence MACD Relative Strength Index RSI KDJ Indicator KDJ Williams R Bias Ratio Bollinger Bands Fast Stochastic Oscillator Slow Stochastic Oscillator Volume Moving Average Another good thing is the you can now see the chart in OHLC or in Candlestick pattern earlier only line charts are available You can change the chart pattern using the Settings link at the


